Introduction
Runviewer is used for viewing, graphically, the expected changes in each output across one
or more shots, and is shown in Fig. 1. Its use is optional, but can be extremely useful for
debugging the behaviour of experiment logic. The output traces are generated directly from
the set of hardware instructions stored in a given hdf5 file. This provides a faithful representation
of what the hardware will actually do. In effect, runviewer provides a low level
representation of the experiment, which complements the high level representation provided
by the experiment logic written using the labscript API. As such, runviewer traces provide
a way to view the quantisation of outputs, [2] which can be seen in the central_Bq and
central_bias_z_coil channels in Fig. 1. You can also view the pseudoclock outputs.
The pulseblaster_0_ni_clock and pulseblaster_0_novatech_clock channels demonstrate
the independent clocking of devices from a single PulseBlaster pseudoclock. Similarly,
pulseblaster_1_clock shows an entirely independent secondary pseudoclock.
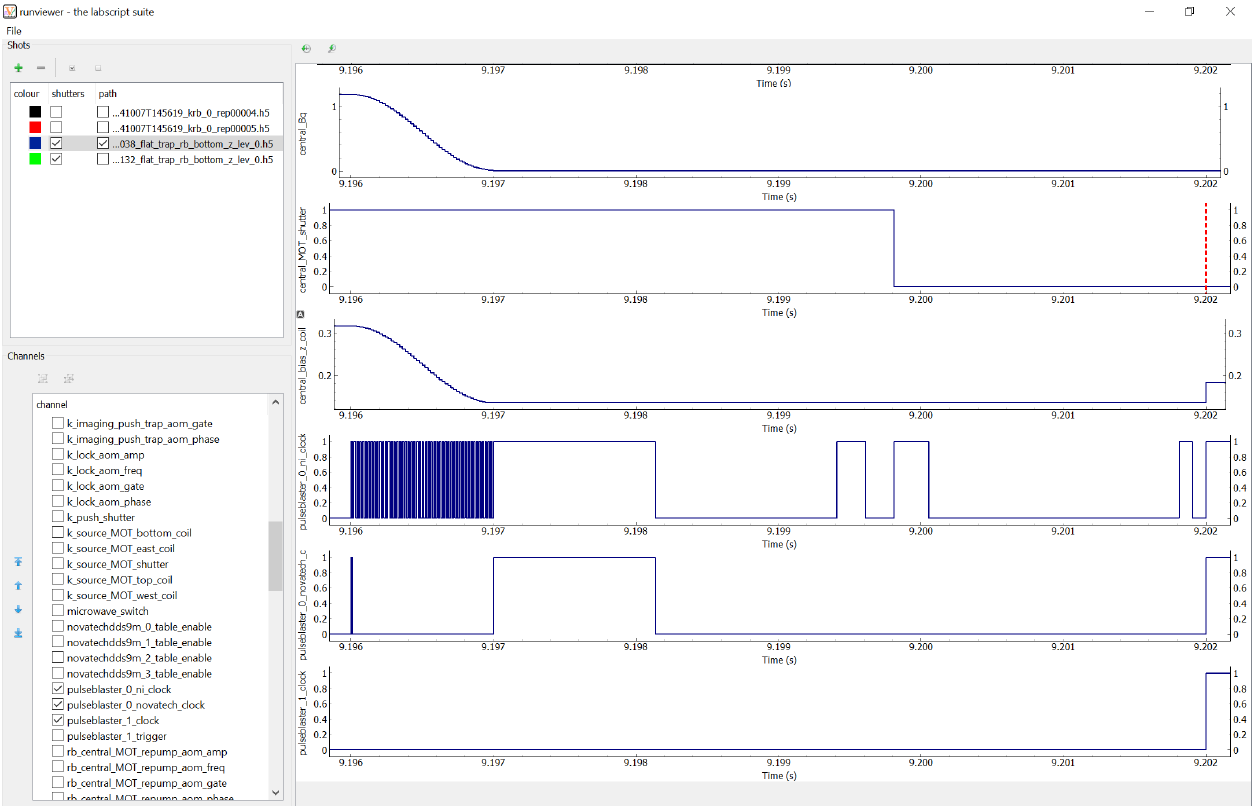
Fig. 1 An example of the runviewer interface.
Footnotes